Sunday, 1 September 2013


MEDIA ARTS DESIGN 3

ASSIGNMENT 02
  • Focuses on animated information graphics that has linear structure of statistical content delivery.
  • Visual and textual content should be created in a semi-direct visual representative manner.
  • Gather, analyze, create and provide a statistical data chart.

I G N I T E

For this project i decided to create a statistical data on something that ive been doing in my daily life. 
I chose a topic for my statistic data which is about 
"How many times I light up the lighter in 7 days with 3 difference in colour kind of lighter"
I chose this topic because it is what i realized i keep doing in my daily life, lighting up the lighter.
And im sure most of us do light up the lighter in our daily life. I decided to do about the little things
I do in my life and it is something i need for everyday use. I think it will be presentable enough for 
the audience and it contains a simple content of me.

RESEARCH

LIGHTER

A lighter is a portable device used to generate flame.
It consits of a metal or plastic container filled with a flammable fluid or pressurized liquid gas,
a means of ignition, and some provision for extinguishing the flame.


For this project I used two softwares to create my video. 

-Adobe After Effects CS6
is a digital motion graphics, visual effects and compositing software package published by Adobe
Systems, used in the post-production process of filmmaking and television production. 
Its main uses are the origination of 2D and 2.5D animation, visual effects compositing and finishing (image adjustments, colour correction, etc.)
Can be used as a basic non-linear editor and a media transcoder.

-Adobe Premiere Pro CS6
a timeline-based video editing software application. 
it is part of the Adobe Creative Suite, a suite of graphic design, video editing
and web development programs.

Video Reference


STATISTIC DATA

7 Days of Analysis
Light up the Lighter


IGNITE PROCESS

1. I use after effects to create different types of light visuals.


2. Lastly uses Adobe Premiere Pro CS6 to compile effects and create transitions in video.


FINAL VIDEO


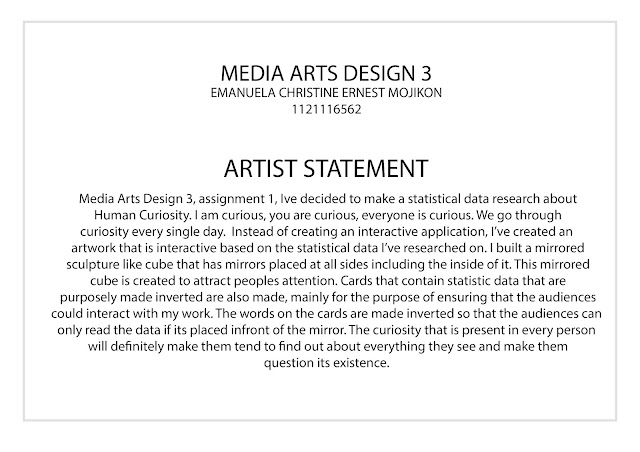
ARTIST STATEMENT


Tuesday, 16 July 2013

FINAL WORK
&
(artist treatment)

HUMAN
CURIOSITY


Mirrored cube is built using squared mirrors on all sides including the inside of it. 
Mirrors are glued together from the inside and the outside.
The sides are covered with black hard paper to cover them up.

Inverted words are printed on random coloured papers in order to make people interact with the mirrored cube. 
the words can only be read when shown to mirrors.

--


HUMAN CURIOSITY

Concept Board


ARTIST STATEMENT


DURING INSTALLATION


Classmates trying to read the inverted sentence through the mirrored cube during the installation.


Another one of our lecturer using my mirrored cube for an example in class.

Tuesday, 9 July 2013

Human Curiosity

For our 1st assignment , we are instructed to conduct a research that is related to statistical data that is available online. We are asked to create an output that needs to be done in an interactive way either by electronic or non-electronic way. As for me, statistic data is something that represents a finding or data that is presented in a diagram that visualizes the information.

For this assignment i have chosen to do about human curiosity.
Curiosity is a quality related to inquisitive thinking such as exploration, investigation and learning, evident by observation in human and many animal species. The term can also be used to denote the behaviour itself being caused by the emotion of curiosity. As this emotion represents a thirst for knowledge, curiosity is a major driving force behind scientific research and other disciplines of human study.


Some people are constantly seeking out answers to life's pressing questions as though they have a voracious appetite for knowledge that can never be satisfied, while others couldn't care less. Webster defines curiosity as the "desire to know," whether that be an interest in other peoples' affairs or an interest in intellectual pursuits leading to injury.


here's a statistical data about what makes a triggers the curiosity of a human.


Humans are more curious to the new things and technology that is available around us, that is science.
Science boost up the curiosity in humans in order to gain more ideas. Other than that, humans are also curious about themselves, art and work/health. Everything we do, we are curious.

The research aimed to get beyond the recognized geek population and gauge interest in science among the roughly 150 million Americans age 18-54. About 40 percent of them, or 60 million people, were found to be "intellectually curious" about politics, the arts and science, all spending significant time with newspapers, related television channels and online media.
Among the intellectually curious group, those who are aware of science-oriented websites tend to visit them frequently. Some 85 percent said they are intrigued by scientific breakthroughs and innovation, compared to 35 percent of those outside the group. And while 72 percent of the intellectually curious say science is relevant to many aspects of their lives, that figure is 26 percent among the rest of the population.

Further study of the intellectually curious segment revealed three distinct groups. If you are reading this, you likely fit into one of them:


Science with Passion (14 percent of the 18-54 group): This group contains the geeks and nerds. They don't need to be prompted to share their love of science. "They might switch a cocktail party from politics to science," said OMD researcher Mike Hess in a telephone interview. They watch the Discovery Channel, the Science Channel and PBS. Prime interests: nature, medicine and the environment. This group is 53 percent female.


Money, Success and Science (11 percent of the 18-54 group): These people are also very interested in science. But they're unlikely to discuss it. The study did not reveal why, but they were also very interested in privacy and their higher interest in careers and success suggests they do not want to be perceived as nerdy, Hess speculated. They are notably interested in the Sci-Fi channel as well as science programming. Prime interest: technology. This group is 64 percent male.


Style with Science (15 percent of the 18-54 group): This high-income group follows science but would rather be throwing a party or out on the town than watching TV or having a quiet evening. They do like "Desperate Housewives," however. "If an opportunity arises at a cocktail party [to discuss science] they'll engage," Hess said. Prime interests: technology, weather and nature. This group is 57 percent male.
more information about human curiosity:
Examples of statistic data


Media Arts 3 - 1st Assignment

MMA2113 Media Art Design 3 | Assignment 01 Brief (50%)
Task: Re-visualized statistical data into metaphoric creative interaction!

This is an individual project. Students are required to conduct research related to statistical data available online.
All findings, information and statistical data samples should be made availableand uploaded into blog (please include your resources + links).Choose only ONE statistical data sample from your findings and state the reason why you choose it in short summary.

Idea development: Develop the understanding of your chosen sampleby doing more in-depth ‘design, art and interactive’ related research for your artwork idea developments.Brainstorm.Students are encouraged to ‘play’ with metaphoric subject, apply semantic and semiotic language in creating their artworks.Idea development sketches. Re-visualized your statistical sample! DO your artist statement to express the whole concept and purpose of your artwork. You should have your project title and brief at this point.

Non-electronic or electronic interactivity: it’s your choice. Students are free to choose any kind of interactivity methods for their assignment but the interactive work must carry statistical data from chosen sample.Sketch and explain your creative interaction ideas. Screen design is not mandatory.Sky is the limit.
Good Luck.


Evaluation Criteria
Process: Research:8% and Idea development process:12%
Final: Overall concept and creativity: 10%, project execution and interactivity: 15%, concept board: 05%


Submission: Week 6
A4 sketches:project brief + idea development sketches (clear folder)
- CDROM: Working files + video documentation of your creative interaction + blog content
- Concept board (name, id, artist statement at the back)
- Blog

Monday, 21 January 2013

CONCEPT BOARD 


ANIMAL EXTINCTION: 
ALMOST GONE

ARTIST TREATMENT:
Adobe Illustrator CS5

ARTIST STATEMENT:
Media art design 2, final project, I’ve made an interactive application that is  more of an informative type. I decided to make this type of application, in order to give out information to people about the six animals that are going through extinction which is the Sumatran Tiger, Javan Rhinoceros, Cross River Gorilla, Borneo Pygmy Elephant, Giant Panda and the Polar Bear. These animals only exists in one or two countries and we should know about their extinction in order to save them.


FINAL DESIGN FOR THE PAGES


1.HOME PAGE


PAGES DESIGN

SUMATRAN TIGER

CROSS RIVER GORILLA

JAVAN RHINOCEROS

BORNEO PYGMY ELEPHANT

GIANT PANDA

POLAR BEAR